A cluster is comprised of a number of similar feature vectors group together. If there are ‘d‘ features used to describe the data, a cluster can be described as a region in d-dimensional space containing a relatively high density of points separated from other such reasons regions by regions containing a relatively low density of points.
The problem of deciding how many clusters exist in a data set in a non-trial one. The number of clusters will depend on the resolution with which the data is viewed.
Similarity Measures
The most obvious measure of similarity between two patterns is the distance between them. A simple term of cluster analysis involves computing the matrix of distances between all pairs of patterns in the data set (using the Euclidean distance, for example).
The distance between patterns in the same cluster should then be much less than the distance between patterns in different clusters.
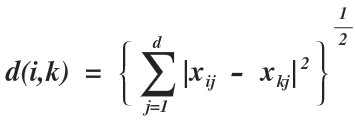
The most common proximity index is the main cause Minkowski metric which measures dissimilarity. For a d-dimensional feature vector.
xi = (xi1, xi2, …………………xiα)T
The Minkowski metric indicating the dissimilarity between xi and xk is defined by (r ≥ 1)

This is a General definition from which the three most common distance measures are obtained.
1. R = 2 (Euclidean Distance)

2. R = 1 (Manhattan or City block distance)

3. R → ∞ (Sup distance)
d(i,k) = max |xij, xkj|
The Euclidean distance is by far the most regularly used metric. However, it implicitly assigns more weightage to features with large range than those with small ranges.
Suppose that two features in a weather prediction system are the pressure ‘P’ which might vary from 700 to 1100 millibars and the temperature ‘T’ which is given in the range of − 10 to − 30 degree Celsius.
The Euclidean distance between two feature vectors (Pi, Ti) and (Pk, Tk) will depend primarily on the pressure difference rather than the temperature difference because the former as a dynamic range which is an order of magnitude greater than.
To prevent features from dominating Euclidean distance calculations owing to large numerical values, the feature values are first normalised to have zero mean and unit variance overall ‘n’ patterns.
The normalisation can be done if the patterns are having the normal distribution. An alternative to normalising data into used normalised distance such as Manhattan distance,
If the covariance matrix is an identity Matrix then its distance reduces to Euclidean distance.
