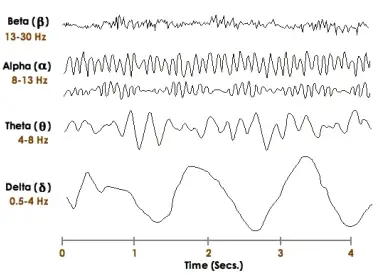
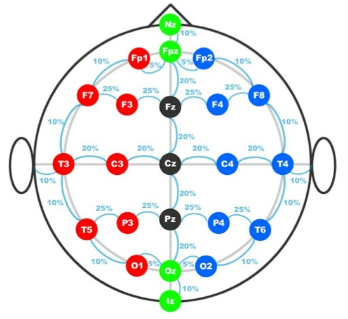
Electroencephalography or EEG is the technique of capturing brain’s electrical activity. It was first discovered by Hans Berger in 1929. EEG signal recording can be done using scalp electrodes or intracranial procedure of capturing EEG. International 10-20 system of electrode placement is widely used across the globe for recording scalp EEG. Neurologist classified the brain activity into certain rhythms which constitute the EEG signal in various physiological and psychological states, and environmental conditions, as described below.
The rhythmic activities in a normal EEG are
- Alpha activity
- Beta activity
- Delta activity
- Theta activity

1. Delta Wave
- It refers to frequencies ranges from 0.5 to 4 Hz
- Amplitude: 20-200 pV
- Found during periods of deep sleep in most people
- Characterized by very irregular and slow wave patterns.
- Also useful in detecting tumors and abnormal brain behaviors
2. Theta Wave
- It ranges from 4 Hz to less than 8 Hz.
- Amplitude: 20-100 pV
- Theta rhythms are dominating in normal infants and children, in adults found mostly during sleep and drowsiness.
- It’s uncommon in the wakeful state of adults. If it exists with high frequency in a wakeful state in adults, indicate a condition of abnormality.
3. Alpha Wave
- It ranges from 8 to 13 Hz.
- Amplitude: 20-60 pV
- Most common among healthy adults during relaxed mind.
- It vanishes in a thoughtful state as well as during ocular activity.
4. Beta Wave
- Frequency ranges from 13 to 30 Hz.
- Amplitude: 2-20 pV
- These are the most common form of brain waves and are present during mental thought and activity.
Activity above 30 Hz is considered as Gamma rhythm. These rhythms don’t signify to clinical or physiological interest and are generally filtered out during EEG recording.
Clinical Use of EEG
Routine EEG is typically used in the following clinical circumstances:
- To distinguish between epileptic seizure from another type of spells such as phycogenic non-epileptic seizures, syncope (fainting), sub-cortical movement disorders and migraine variants.
- To differentiate “organic” encephalopathy or delirium from primary psychiatric syndrome such as catatonia.
- To prognosticate, in certain instances, in patients with coma.
- To determine whether to wean anti-epileptic medications.
Sometimes routine EEG is not sufficient particularly in cases when it is required to record EEG while the patient is having a seizure. In such cases, the patient may be admitted to the hospital for days or even weeks and EEG is constantly being recorded. A recording of an actual seizure can give significantly better information about whether or not a spell is an epileptic seizure and which part of the brain is having a seizure.
10-20 System (EEG)
- The 10-20 system or International 10-20 system is an internationally recognized method to describe and apply the location of scalp electrodes in the context of an EEG test or experiment.
- This method was developed to ensure standardized reproducibility so that a subject’s studies could be compared over time and subjects could be compared to each other.
- This system is based on the relationship between the location of an electrode and the underlying area of cerebral cortex. The “10” and “20” refer to the fact that the actual distances between adjacent electrodes are either 10% or 20% of the total front-back or right-left distance of the skull.
- Each site has a letter to identify the lobe & a number to identify the hemisphere location. The letters F, T, C, P, and O stand for frontal, temporal, central, parietal, and occipital lobes, respectively.
- Even numbers (2,4,6, and 8) refer to electrode positions on the right hemisphere.
- Odd numbers (1,3,5, and 7) refer to those in the left hemisphere.
- The figure shows a single plane projection of the head showing the standard electrode sites of the international 10-20 system.

Artifacts in EEG
One of the historical downsides of EEG measurement has been the corruption of EEG data by artifacts.
Artifacts are the electrical signals that are picked up by the scalp electrodes that do not originate from cortical neurons.
These artifacts within an EEG measurement have a prominent spiky but repetitive (rhythmical) nature, whereas the majority of other artifacts arc transients or noise-like in shape. The artifact in the recorded EEG may be either patient-related or technical.
Patient Related Artifacts
- Any minor body movements
- EMG
- ECG (pulse, pacemaker)
- Eye movements
- Sweating
Technical Related Artifacts
- 50/60 Hz interference
- Impedance fluctuation Cable movements
- Broken wire contacts
- Too much electrode paste
