Electrocardiography is the process of recording the electrical activity of the heart over a period of time using electrodes placed on the skin. It is abbreviated as (ECG or EKG). A normal ECG is shown below.
 |
| Fig. 1 |
Electrocardiograph
An electrocardiograph is a machine that is used to perform electrocardiography.
Electrocardiogram
It is the heart’s ECG response which is displayed on the paper as shown in Fig. 1.
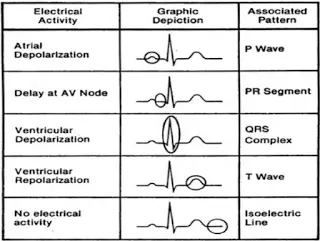
Elements of the ECG
(a) P wave:
- Depolarization of both atria.
- Amplitude = 0.25mV
- Duration = 0.11 sec
(i) A relationship between P and QRS helps in distinguishing various cardiac arrhythmias.
(ii) Shape and duration of P may indicate atrial enlargement.
(b) PR interval:
(i) Normal duration = 0.12 – 0.2 seconds (120 – 200 msec).
(ii) Represents atria to ventricular conduction time (through his bundle).
(iii) Prolonged PR interval may indicate a First degree of a heart attack.
(c) QRS Complex:
(i) Ventricular Depolarization
(ii) Larger than P wave because of the greater mass of ventricles.
(iii) Normal Duration = 0.08 – 0.12 seconds
(iv) Its duration, amplitude, and morphology are useful in diagnosing cardiac arrhythmias, ventricular hypertrophy, myocardial infarction (MI), etc.
(v) Q wave is greater than one-third the height of R wave. Duration greater than 0.04 sec treated as abnormal and may represent MI.
(d) ST Segment:
(i) Connects the QRS Complex and T wave.
(ii) Duration = 0.08 – 0.12 sec (80 – 120 msec)
(e) T wave:
(i) Represents repolarization or recovery of ventricles.
(ii) The interval from the beginning of QRS Complex to the apex of T wave is referred to as the absolute refractory period.
(iii) Amplitude = 0.1 – 0.5 mV.
(f) QT Interval:
(i) Measured from beginning of QRS complex to the end of the T wave.
(ii) Normal QT is usually of about 0.35 – 0.44 sec.
(iii) QT interval varies based on heart rate.
ECG Lead Configurations
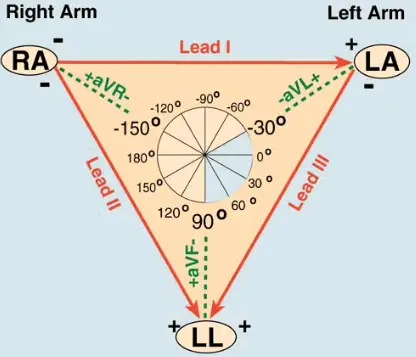
An ECG is a series of waves & deflections recording the heart’s activity from a certain view. Many views, each called lead, monitor voltage changes between electrodes placed in the different position of the body. The 12-lead ECG provides spatial information about the heart’s electrical activity in 3 approximately orthogonal directions.
Right ⇔ Left
Superior ⇔ Inferior
Anterior ⇔ Posterior
Each of the 12 leads represents a particular orientation in space as indicated below. (RA = Right arm; LA = Left Arm; LF = Left foot)
Conventionally 12 Standard leads are used frequently.
(a) Bipolar Limb Leads
(b) Unipolar (augmented) limb leads
(c) Unipolar Chest leads
(a) Bipolar Limb Leads (frontal plane)
- Lead-I: RA(−) to LA(+) (Right left or lateral)
- Lead-II: RA(−) to LF(+) (Superior Inferior)
- Lead-III: LA(−) to LF(+) (Superior Inferior)
(b) Unipolar (augmented) limb leads (frontal plane)
- Lead-aVR: RA(+) to (LA & LF) (−) (Rightward)
- Lead-aVL: RA(+) to (RA & LF) (−) (Leftward)
- Lead-aVF: RA(+) to (RA & LA) (−) (Inferior)

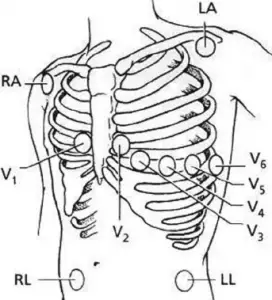
(c) Unipolar Chest leads or Chest Electrode Placement (Horizontal plane)
There are 6 Unipolar Chest leads.
V1: In the fourth intercostal space (between ribs 4 and 5) just to the right of the sternum (breastbone).
V2: In the fourth intercostal space (between ribs 4 and 5) just to the left of the sternum.
V3: Between leads V2 and V4.
V4: In the fifth intercostal space (between ribs 5 and 6) in the mid-clavicular line.
V5: Horizontally even with V4, in the left anterior axillary line.
V6: Horizontally even with V4 and V5 in the midaxillary line.
|
Views of the Heart
|
|
|
Chest Leads
|
View
|
|
V1 and V2
|
Right Ventricle
|
|
V3 and V4
|
Septum/Lateral Left Ventricle
|
|
V5 and V6
|
Anterior/ Lateral Left Ventricle
|

Excercise
Q. What is Cardiac Vector?
Ans. Cardiac Vector is the net result of the directions of the spread of depolarisation waves from the SA node through the atria, AV node, interventricular node septum, ventricles, and to the apex of the heart, the last part of the heart to be depolarised is the base of the heart.

